A Monthly Search Average Hides Seasonal Peaks
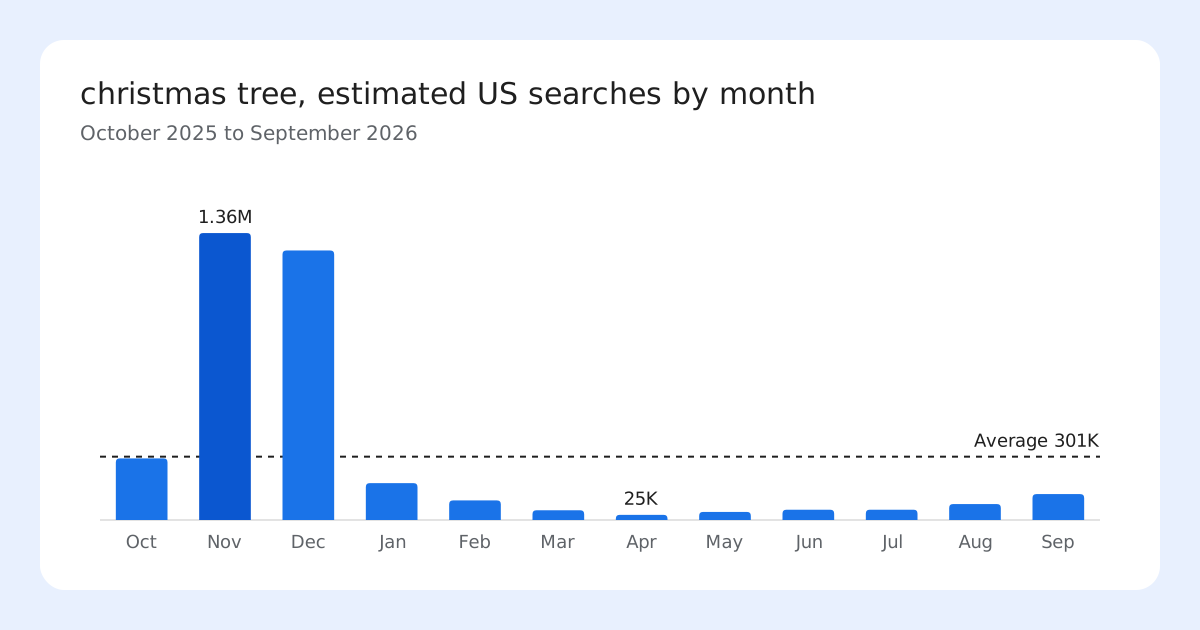
Christmas tree averages 301,000 US searches a month, but its November estimate is about 1.36 million. How to turn a yearly average into month-by-month demand.
Keyword tools report average monthly searches: the year's searches divided by 12. For a keyword with steady demand that number describes most months well. For a seasonal keyword it describes almost none of them.
Three seasonal keywords and one steady one
The figures below come from KWS Trends reports for the US, covering October 2025 to September 2026. Each report splits the yearly total (12 times the average) across the 12 months in proportion to Google search interest in each month, as described on the methodology page.
| Keyword | Average per month | Busiest month | Quietest month |
|---|---|---|---|
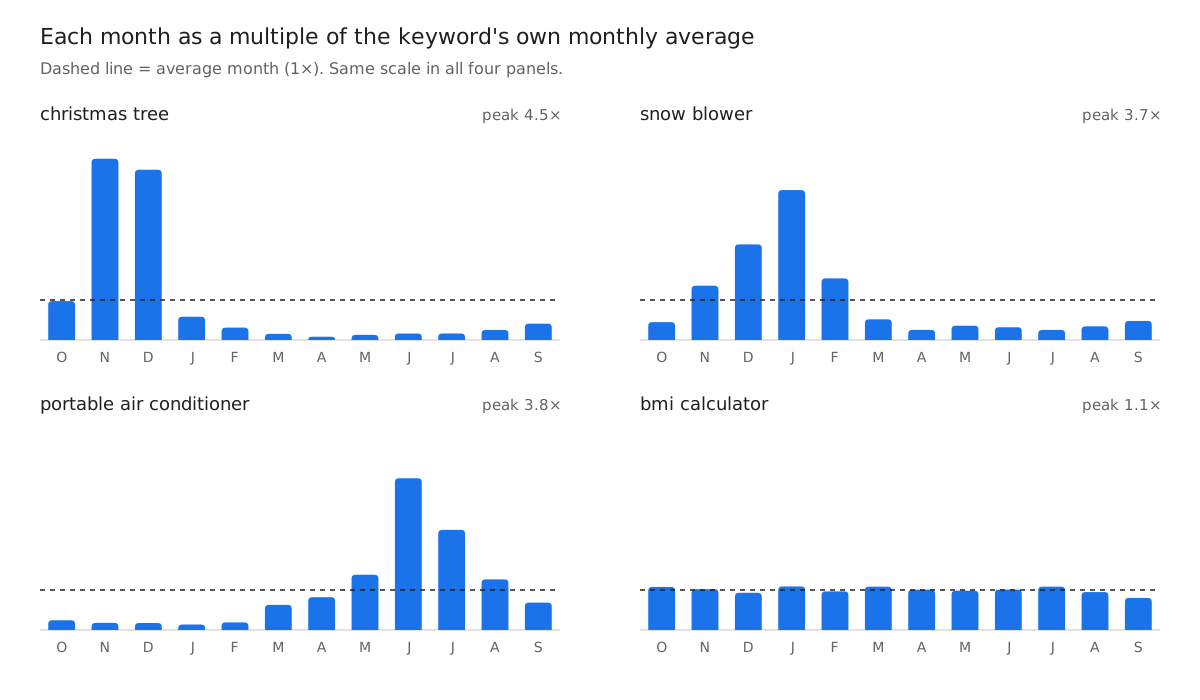
| christmas tree | 301,000 | Nov 2025, about 1.36 million | Apr 2026, about 25,000 |
| snow blower | 165,000 | Jan 2026, about 618,000 | Jul 2026, about 42,000 |
| portable air conditioner | 201,000 | Jun 2026, about 762,000 | Jan 2026, about 27,000 |
| bmi calculator | 5,000,000 | Jan 2026, about 5.45 million | Sep 2026, about 4.01 million |
For christmas tree, the busiest month had about 4.5 times the average and about 56 times the quietest month. Planning a page or an ad budget around 301,000 a month would overstate demand for ten months of the year and understate November and December by a factor of four.
bmi calculator is the opposite case. Its busiest and quietest months are within 40% of each other, so the average is a fair description of any single month.
When demand starts to rise
The month a keyword starts climbing matters more than the peak month if you publish content for it. Search engines need time to find and rank a new or updated page, so a page that goes live at the peak gets only part of the season.
For portable air conditioner, the estimates were about 38,000 in February 2026, 126,000 in March, 165,000 in April and 278,000 in May, before the June peak. A page published in June would miss most of the climb. Snow blower shows the same pattern in the other half of the year: about 74,000 in October 2025 and 224,000 in November, ahead of the January peak.
How to check a keyword yourself
- Open the keyword's report and look at the monthly search estimates chart. A flat row of bars means the average is safe to use. Bars that rise and fall by more than about 2 times mean you should plan by month.
- Switch the trend chart to 5 years. One seasonal year can be an accident; the same peak in four or five years is a pattern.
- Note the month the bars first rise above the average, not only the peak. That is the date to have the page ready by.
Google Trends shows the shape of the year on a 0 to 100 scale but no search counts. The average monthly searches give a count but no shape. Each report on this site multiplies one by the other, so both questions, how many and when, have an estimate in the same chart.
Limits of the monthly estimates
The monthly figures are estimates built from two sources. The yearly total comes from a keyword database and may cover a slightly different 12 months from the Google Trends data. If Google search interest is missing or zero for a month, the report shows no monthly estimates. For low-volume keywords the interest line is often noisy, so single-month figures for those keywords are less reliable than for the examples above.